Separate hotels don't need separate solutions! Quite on the contrary: cluster revenue managers rather need one single solution that works for all properties.
With the release of the Multi Property Dashboard, HQ revenue takes this conviction into account. Revenue managers who are responsible for several properties now have a control center that allows them to access all relevant data from all properties - and also provides useful comparison functions.
The goal: Best usability despite demanding challenges
The HQ revenue team asked our customers: How exactly do revenue managers actually deal with a larger number of houses. How does it work at the organizational level? How are multi-properties clustered?
We surmised: There's bound to be some standard!
In interviews with multi-property revenue managers from various hotel chains, we were able to confirm this central assumption with a clear "well, it depends": We found organizations that were structured according to brand clusters, regions or areas, and also according to different hierarchy and thus responsibility levels.
This gave HQ revenue the task of mapping this exactly in the app - so that those responsible can see exactly what is important for their respective area, regardless of the organizational pattern in each case.
The logic of the app should serve the respective organizational logics, i.e. map them with an appropriately elaborated rights and roles regime and provide the revenue managers with adequate functions - for example, to add, combine and edit users and/or groups.
At the same time, of course, the whole thing had to remain child's play to use!
We would say that this worked out quite well.
These are the main news and features:
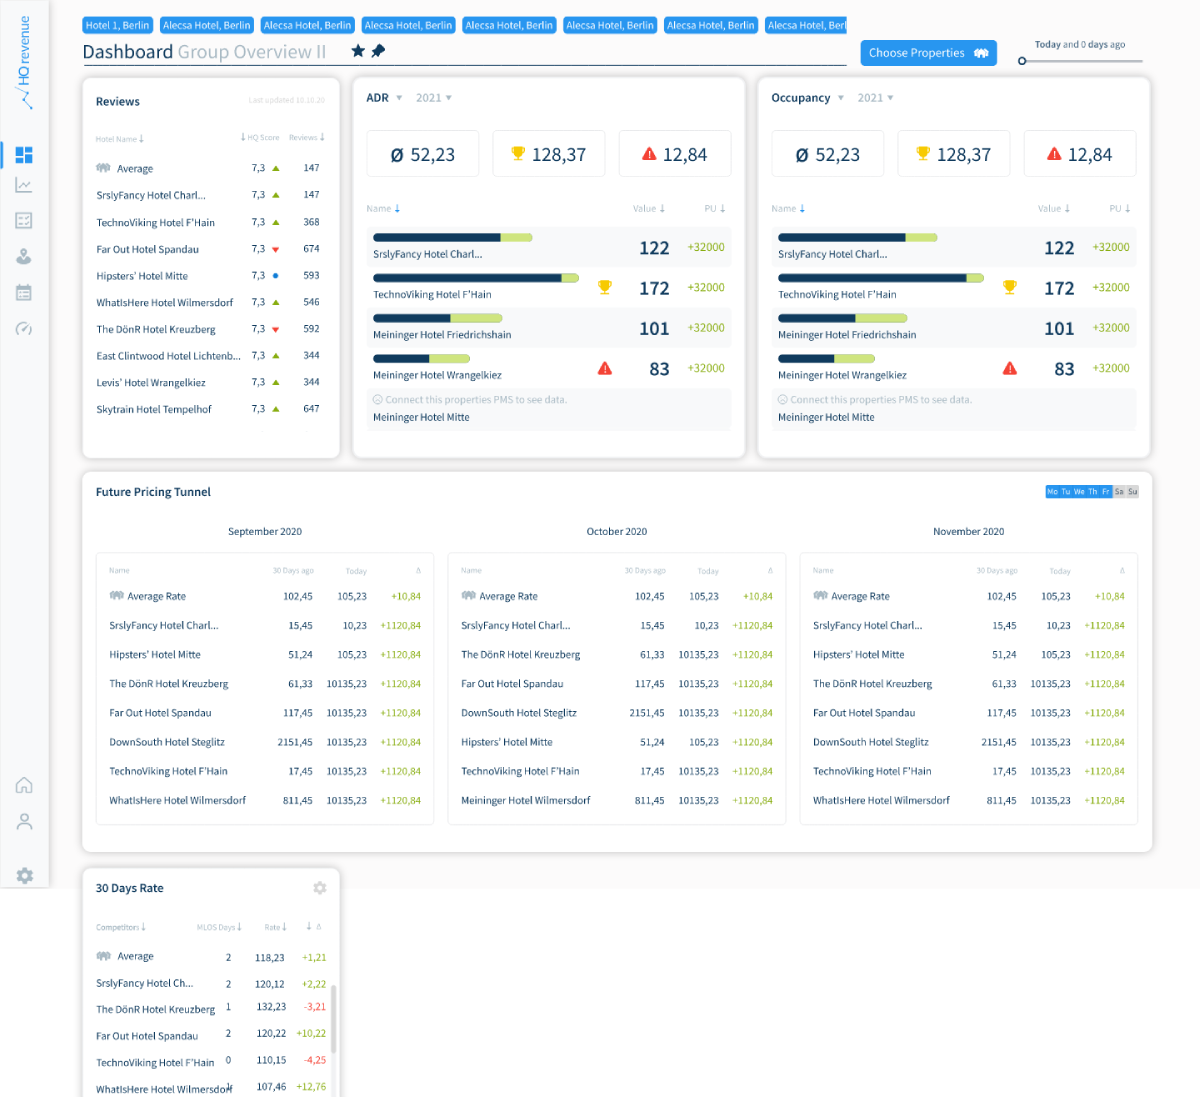
Aggregated dashboards
First things first: The Multi Property Dashboard looks almost exactly the same as our users are accustomed to. Only the navigation has changed slightly, ensuring the accessibility for all corresponding functions and drill-downs as well as keeping the business logic intuitive via menus and buttons.
Using the Choose Properties buttons, you select the houses you want to display on the dashboard and, which should be compared in the individual widgets. You could also call it an "aggregated dashboard".
New widgets, designed specifically for multi-property revenue management
KPI Ranking
The KPI ranking shows the three top and three flop hotels from the chain/the set cluster in the selected period - sorted by the central KPIs Occupancy, RN Def, ADR, RevPAR and Revenue.
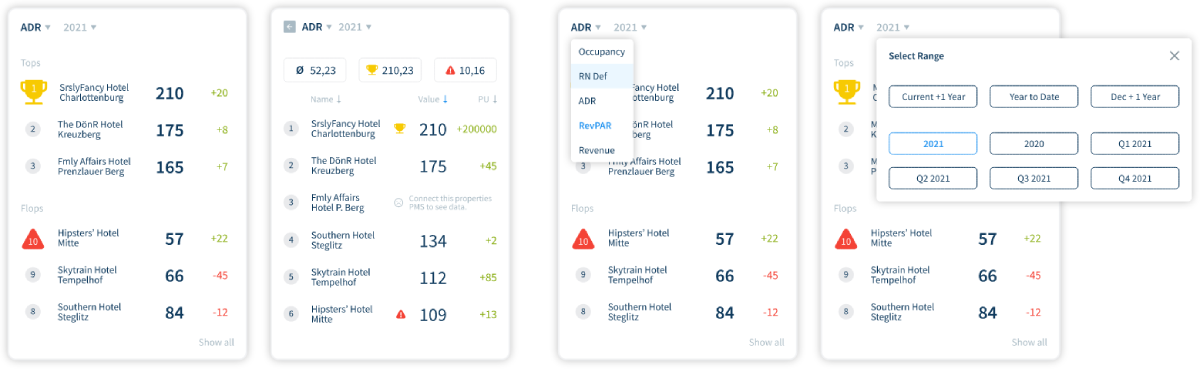
In this new widget, the hotels added to the Multi Property Dashboard are ranked according to selected KPIs and timeframe.
The first level displays the 'Tops' and 'Flops' at a glance. The large numbers in dark blue are the OTB values. In this example, the Average ADR of the whole year 2021 is shown. The green/red values show the change of the values in the respective selected timeslider period.
The second level leads into the details. Here, all added properties are displayed by default in a descending list. Users can also sort by name (alphabetically descending/descending) and by pickup value (descending/descending).
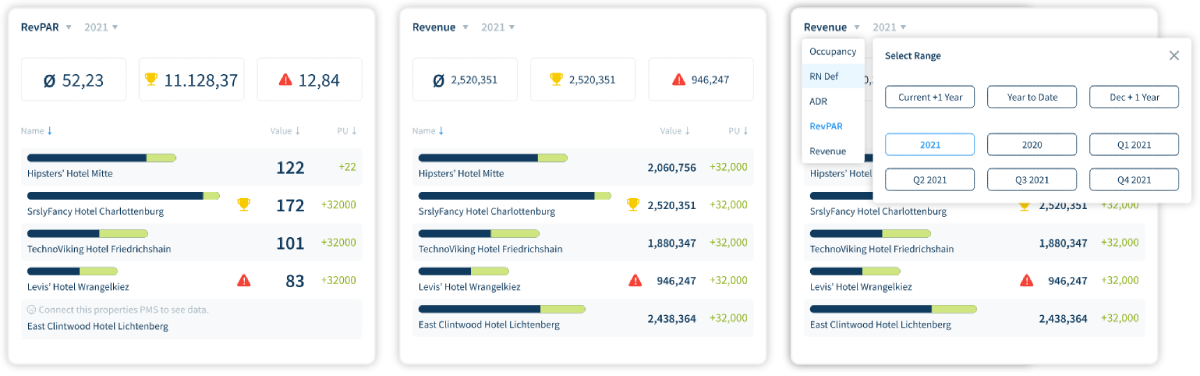
KPI Histogram
In the histogram, the analysis can go one step further: Here, the development of the KPIs in the period selected by the timeslider is visualized differently - and instead of pre-filtering by tops and flops, users can choose the sorting themselves.
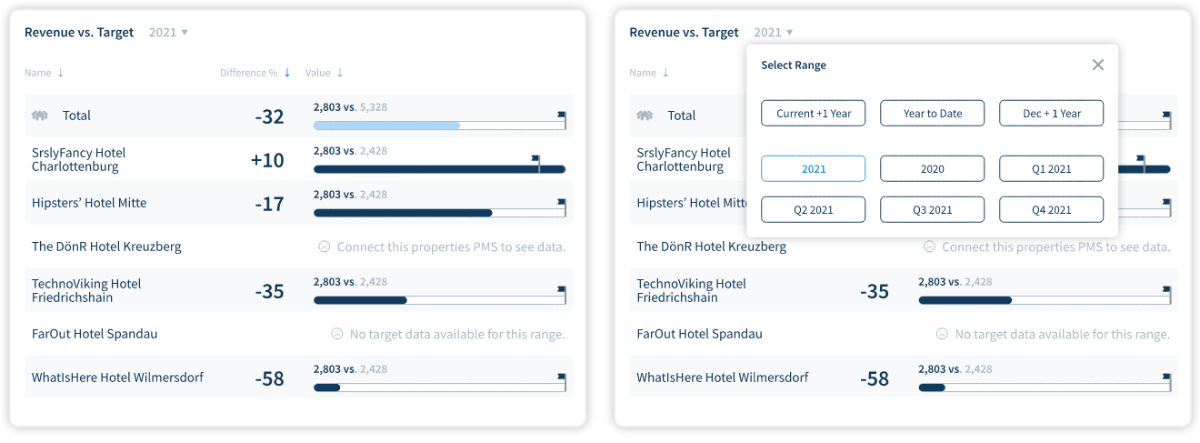
Revenue vs Target
In this view, the sales achieved can be quickly compared with the respective sales target set - as always: for each house for the respective selected time period.
In addition, there are the already known widgets, which have been slightly adapted for Multi Property Revenue Management:
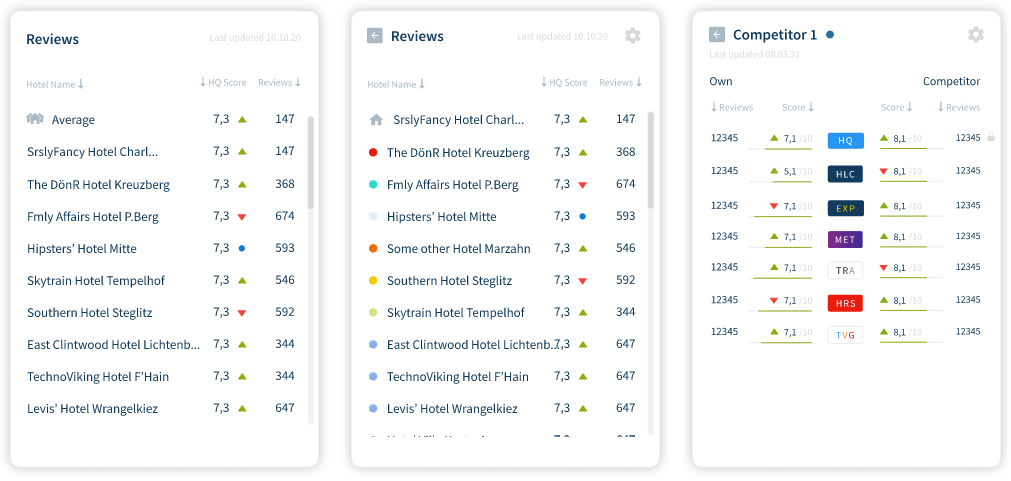
Reviews
The Reviews widget was adapted a bit to especially serve Multi Property Managers. We however added a line for the Average Rating.
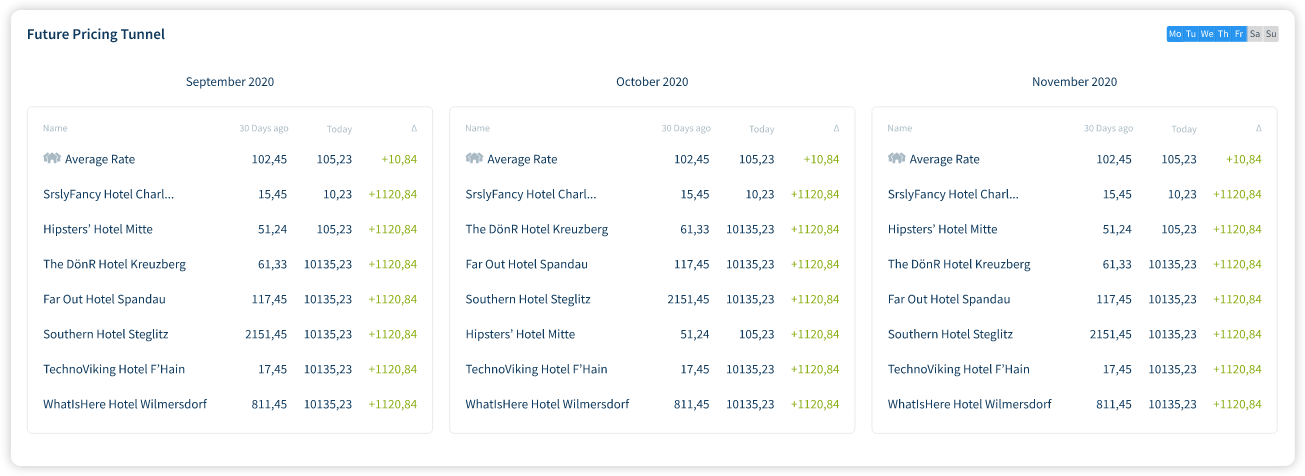
Future Pricing Tunnel
The Future Pricing Tunnel has also been revised for Multi Property Revenue Management. The widget provides an overview of the pricing strategy over the next period in the respective observation frame (i.e. cluster, region, etc.).
30 Days Rate
Finally, we have also upgraded the well-known 30 Days Rate widget for Multi Property Revenue Manager.
Share this

Update: Improved functions for cluster and multi property revenue management

Resorts in Germany: A Recipe for Success