The HQ revenue tools for Multi Property Managers and Cluster Revenue Managers are now available in an improved version. The focus was on the optimization of the user guidance and UX. In addition, another widget has made it into the multi-property world again.
These are the news:
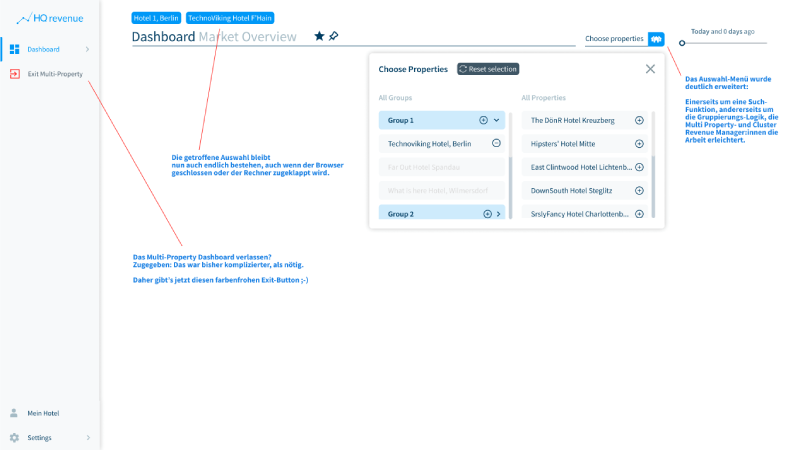
Improved Search Functionality
Sounds trivial at first - but it's especially helpful for cluster revenue managers: The selection menu for compiling the houses now has a search function with which you can add your own houses to the multi-property dashboard.
Cached Selection
With the update, the user's own selection is finally cached, which means that it stays retained when the computer is restarted or the browser tab is reloaded. This eliminates the (simple, but) annoying search for your own hotel set.
Easier Navigation
Groups can now be added with a single click. We have also made it much easier to switch between multi-property and single-property mode: instead of "deselecting" the hotels as before, you can now leave the area using the Exit button.
Group Mode
While the grouping mode was still running via a small workaround during the test phase, the creation of hotel groups is now made easy: It is possible to add multiple hotels to the dashboard with just a few clicks and create and edit both groups and clusters completely on your own.
But don't worry: We are of course still available to support you in personalizing your HQ revenue Suite if you want!
New widgets, designed specifically for multi-property revenue management
KPI Ranking
The KPI ranking shows the three top and three flop hotels from the chain/the set cluster in the selected period - sorted by the central KPIs Occupancy, RN Def, ADR, RevPAR and Revenue.
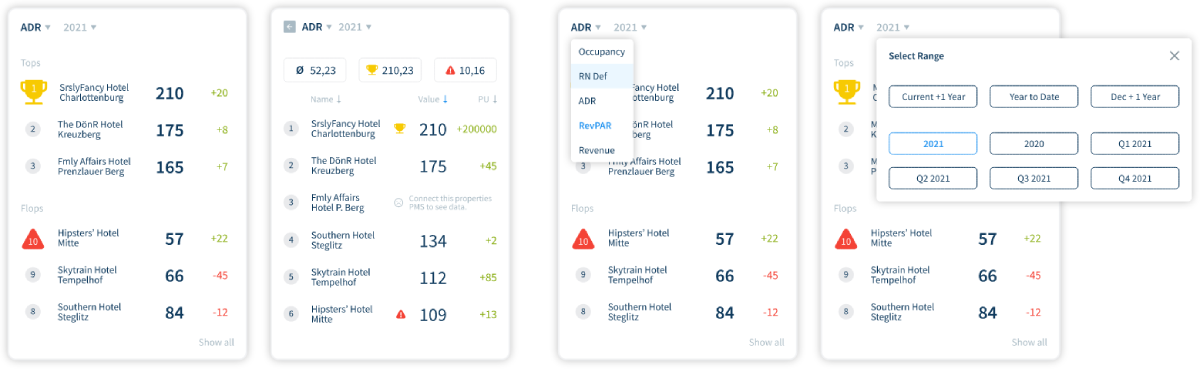
In this new widget, the hotels added to the Multi Property Dashboard are ranked according to selected KPIs and timeframe.
The first level displays the 'Tops' and 'Flops' at a glance. The large numbers in dark blue are the OTB values. In this example, the Average ADR of the whole year 2021 is shown. The green/red values show the change of the values in the respective selected timeslider period.
The second level leads into the details. Here, all added properties are displayed by default in a descending list. Users can also sort by name (alphabetically descending/descending) and by pickup value (descending/descending).
Rev vs. Target
The Revenue vs. Target widget has been developed especially for the Multi Property Dashboard. It shows how much revenue is missing to the set target - in the widget itself time periods can be selected (current, +1y, Q1, Q2, and so on).
This gives you a very quick overview of the performance of the hotels - from a cluster perspective. Rapid resource allocation or rather stress relief because some hotels overshot targets? We leave the conclusion drawing to you.
Share this
HQ revenue Announces Integration with Duetto

Easy Cluster Revenue Management with the Multi-Property Dashboard