Room Type Mapping: Using Data Science to compare Apples and Pears
- "Superior Room with beach view"
- "Junior Princess Sea View Apartment
- "Premium Seaside Junior Suite"
- "THE PLUS Room, Queensize Terrace Ocean View"
You know these room categories, right? Maybe they are your own - maybe those of your competitors. In any case, they probably look pretty familiar to you. The marketing departments send their regards!
As a person with some professional experience, it is probably not that difficult for you to imagine that these cryptic room designations could mean more or less the same thing. So – to be able to compare your own inventory with those of the comp set, you either need a lot of time - or a clever solution.
We do not have time.
Thus, we need a clever solution.
The HQ revenue Room Type Mapping
Room Type Mapping is - basically - the process of overlaying different products from the inventory with those from the comp set - in terms of all the variants that are played out on the Brand.com as well as the OTA pages, i.e.: comparing their congruency.
HQ revenue makes this a walk in the park! Our data science team has developed an algorithm that automates this across channels, to ensure the manual effort is close to none.
Ok, granted: Some human work is needed, in the beginning. Nevertheless, what used to take revenue managers days can now be done in a matter of minutes.
And after all, the machine is supposed to do the goofwork for you. For this to work, the machine needs patterns, i.e. comparable shapes. Because machines are intrinsically stupid.

[Q]
The technical basis: How does RoomType Mapping actually work?
The underlying Data Science Model is in place to support the user: the algorithm analyzes all room types of a house and automatically generates matching supercategories as well as groups of room types.
In this way, the model creates a representation of the inventory. These are displayed in a quickly manageable and easy to use layout.
From a technical point of view, this is anything but trivial – so let's ask HQ revenue's Lead Data Scientist Dr. Ivan Abakumov how this actually works.
Ivan: "HQ revenue's Room Type Mapping performs three tasks: Recognition, assignment, and prediction.
First, the room types must be recognized. To achieve that, we analyze the dozens of millions of historical rate records of the customer and his competitor set. From this huge amount of information, the algorithm extracts room name attributes – or tokens, as we call them – as well as the "usual" room rates and occupancies.
These different room types, as designated in the different OTAs, are then to be combined (or: assigned) in a meaningful way – we call this the room type group. After this, we train our machine learning model, using the Bayesian inference algorithm. This model involves some kind of token database. You can think of it as a thesaurus, or a dictionary that maps the various attributes of rooms (or: tokens) to the respective room type groups.
And finally, we predict the room type group from room name, rate name, room rate and occupancy.”
A task list that already strongly suggests in advance that we would encounter parts of it again at some point. Room Type Mapping was therefore planned and implemented as a microservice architecture from the outset.
On the one hand, this means that future development steps are already taken into account, while at the same time it ensures the stability and scalability that is needed, for example, in the event of load peaks due to high query volumes.
The microservice gRPC architecture is used as a basis. For the prediction of room types, a neural language processing (NLP) model is used that has been trained with historical room type data, room data, and price data. A machine learning technique called Bayesian inference is used to harness the use of different types of information - i.e., text-based features (e.g., room and rate names), room price distributions, and possible occupancies for room type prediction. For each hotel in an HQ revenue account, the model is trained based on the collected historical pricing data. To make a prediction, the model needs the room name, rate name, room rate and occupancy.
Sounds complicated? Well ... yes ... but: it is not!
Room Type Mapping - Easy From the Users' POV
Because HQ revenue is designed with our users’ points of view – which is: making complicated things super-easy.
The room types are displayed in a layout that is easy to understand and use.
But data science or not - in order for the assistance system to work really well, users have to do a little homework: Once, the different room types have to be identified and assigned across the room categories. Even the strongest algorithm needs an initial spark, a data set to get started.
(Read more on this topic: AI & automation for the revenue management)
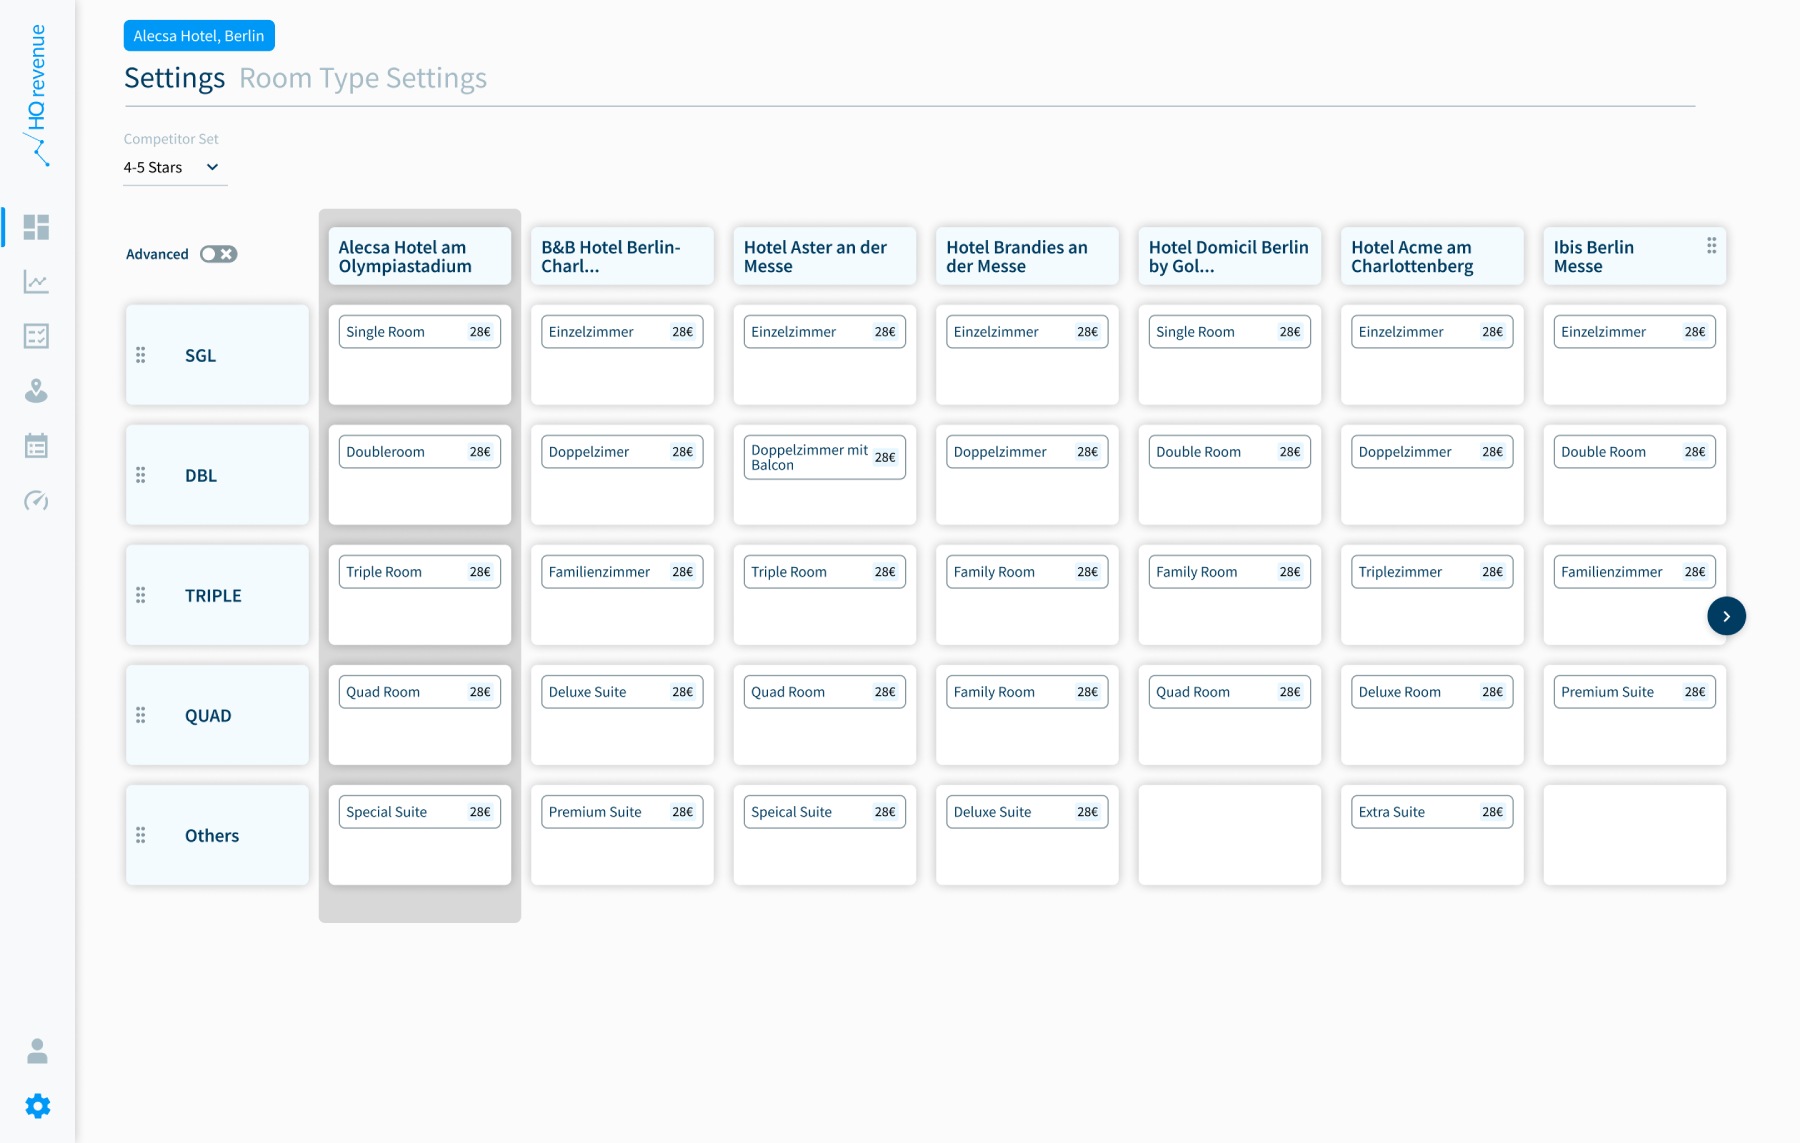
In HQ revenue, this is fairly straightforward via the Room Type Settings. Here, users can In HQ revenue categorize the room types of their property across OTAs to make them comparable to those of the comp set.
Room categories are displayed on the X-axis and properties are displayed on the Y-axis with the corresponding room types listed. If there is a discrepancy, the user can drag and drop the room type across categories.

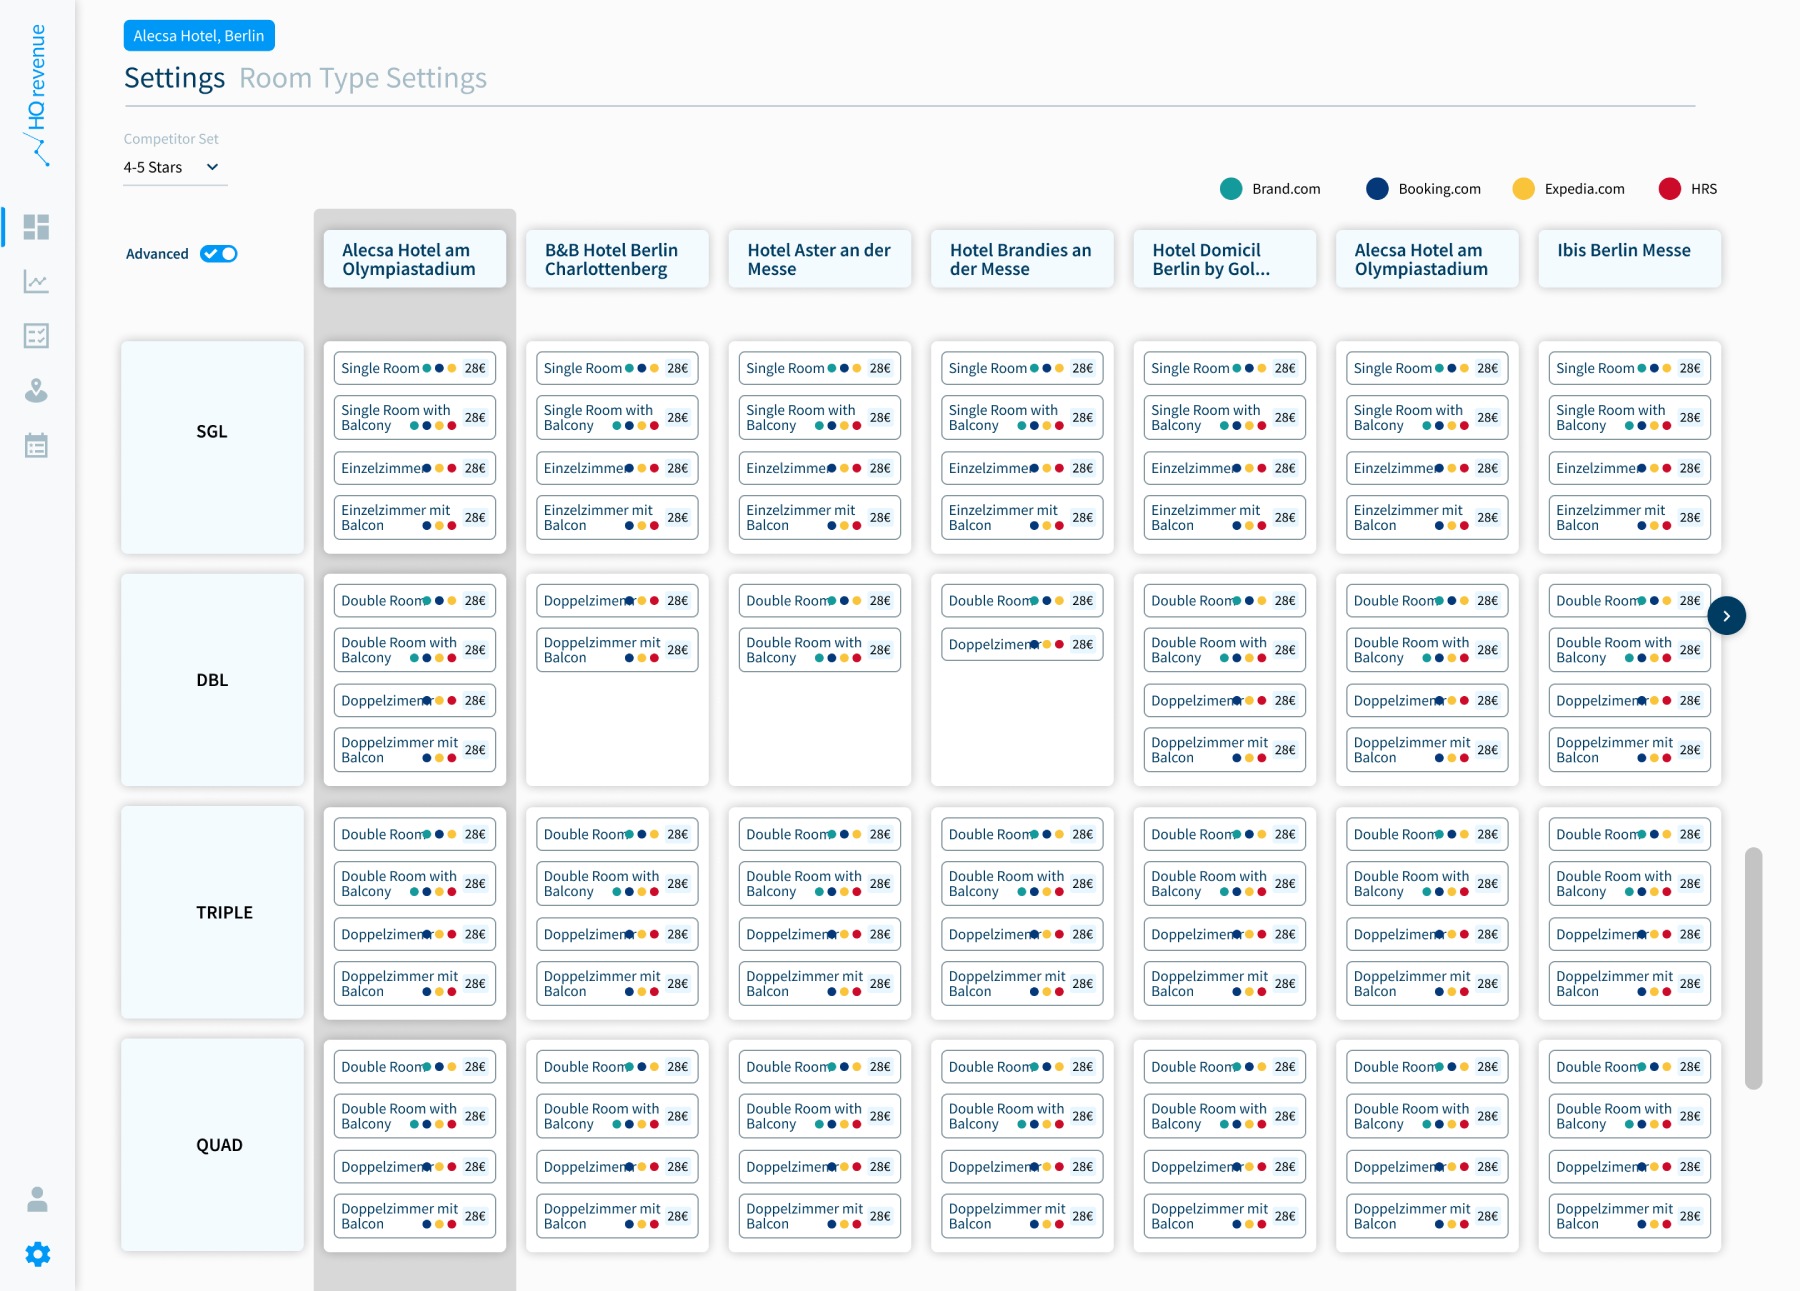
Room types are automatically grouped and displayed in maps.
This significantly reduces the amount of data on the interface - making work much easier and everything much clearer.
The drill down is of course still available:

Bottom Line
With Room Type Settings and automated, algorithm-supported Room Type Mapping, hoteliers and revenue management teams are not only one step closer to real market intelligence again, but also benefit from the simple and targeted manageability of a once complex and annoying topic. And that saves valuable time. And valuable nerves.
Follow us on LinkedIn to stay up to date and to find out at which events the HQ revenue experts will be present and available in the near future!
Share this
You May Also Like
These Related Stories

Top dogs and niche providers: HQ revenue implements Airbnb, Traveloka, Ecohotels and others

Anomalies Alert – Leveraging Upcoming Market Anomalies to be Ahead of the Competition

