Small but mighty - and that twice!
The news in HQ revenue seems to be almost hidden this time – so let’s quickly uncover the new features:
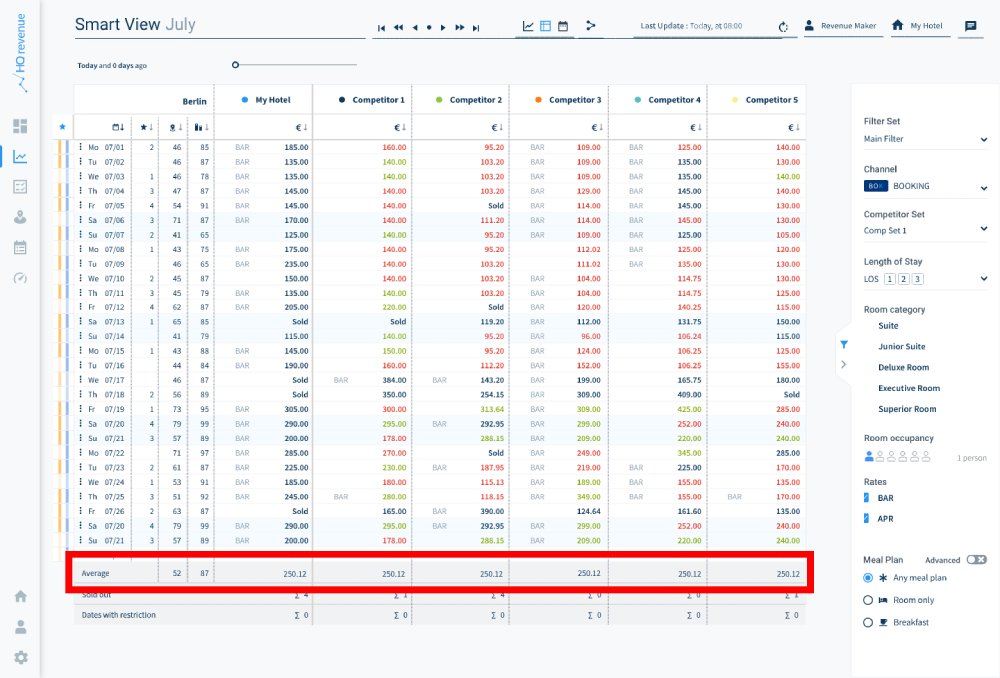
Average row
By multiple request, we have given the HQ revenue Smart View an average line. Well, but aren't all lines average in some way?
Yes, they are. But this one is especially average!
To the lines Soldout and Dates w/ Restriction we added the line "AVG" – it shows the average demand, the average occupancy and the average rate – each for my hotel and my competitors.

On The Books?
On The Widget!
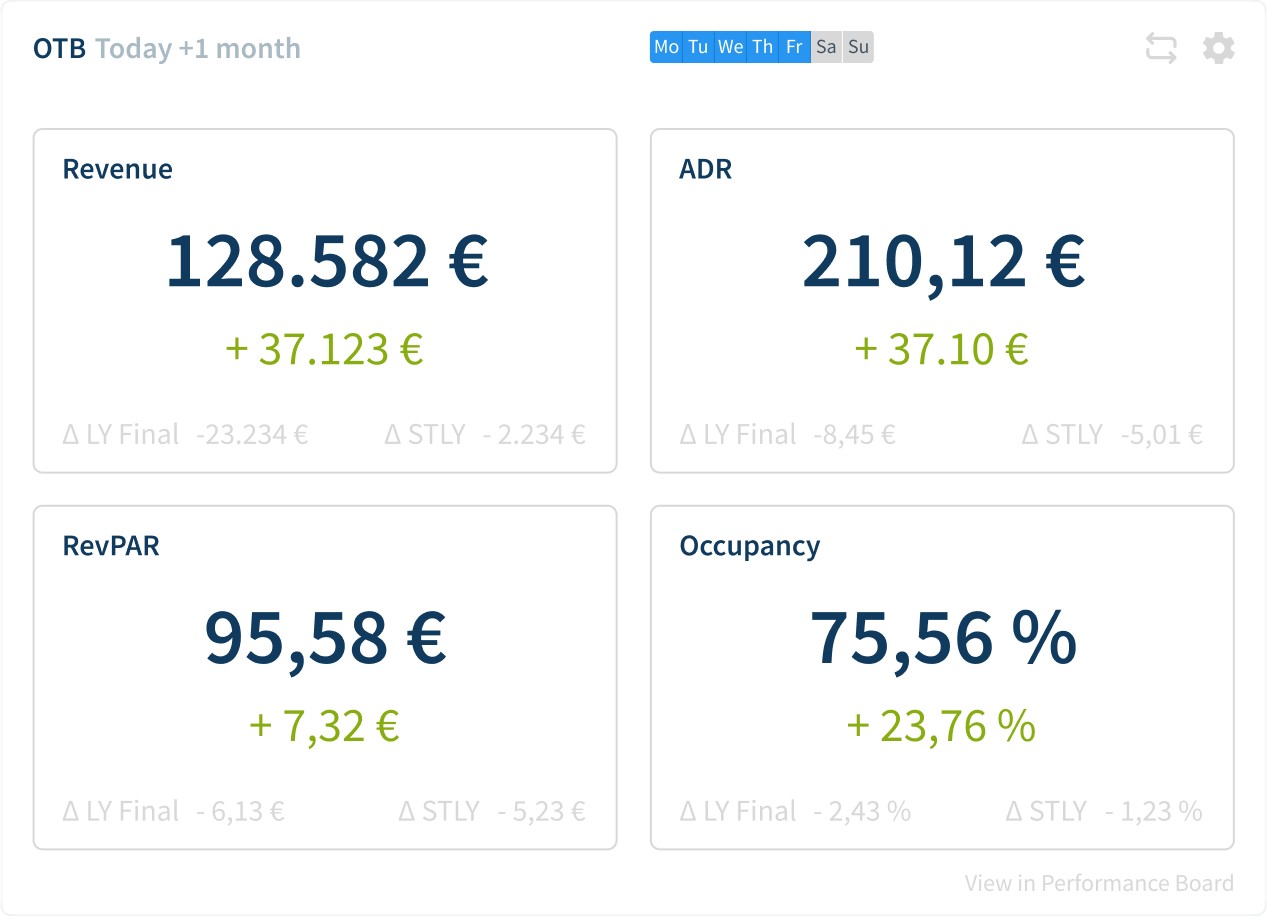
Another widget has made it into the HQ revenue dashboard: The OTB KPI widget displays all the most important on-the-books KPIs at a quick glance – revenue managers will be particularly pleased with the ease of use:

The KPIs displayed by default are
- Average ADR,
- Sum of Revenue,
- Average RevPAR, and
- Average Occupancy / RN Def,
each for the respective selected time period. Furthermore, the pickup value (in green) is displayed - with reference to the time period selected via TimeSlider. In addition, we show the deltas ∆ LY Final and ∆ STLY, if these data are also available.
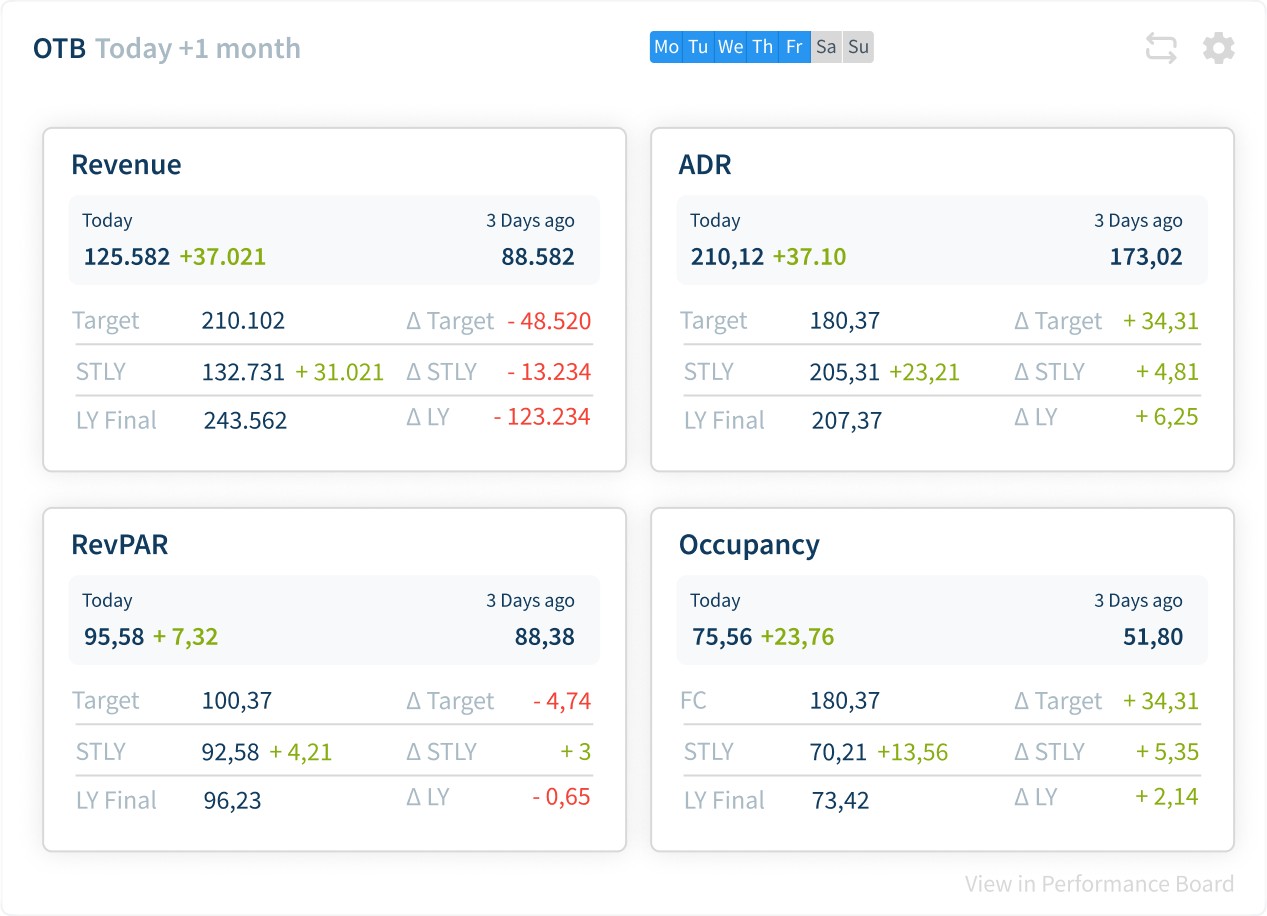
As in most widgets and HQ revenue functions, there is also a drill-down: the maps turn around when hovering the mouse over them and show a more detailed view:

- Value Today and Pickup
- Value X days ago (timeslider setting)
- Target / ∆ (for Revenue, ADR, RevPAR)
- FC / ∆ (for Occupancy, RN Def)
- STLY with Pickup/ ∆
- LY Final / LY Final ∆
We'll move on here then. See you time, happy revenue making!
Go straight into medias res and try everything out? Sure, just make an appointment here: